Virtual reality - "analog-scope feeling" with digital scope
DSO/DPO : Gradient - displaying the Data
The fundamental
contradiction that exists between the number
of horizontal pixel
positions available in a real display device
and the much larger number of data points a modern [digital] scope
acquires had not been resolved.
Until the mid 1990s, all digital scopes used the so-called max-min
method of data compression.
A less lossy data-compression method was needed. (Its arguable which
company first developed a practical version of the intelligent compression
algorithm that maps display intensity to the local density of data points.)
The approach uses display intensity
as an additional variable in
a low-loss data-compression
scheme.
Comparison of Max-Min and "Lossless" compression:
The max-min compression displays the overall range of signal values that occurred during each frame. However, in the intelligently compressed example, line segments are plotted with a color or intensity that corresponds to histogram values.
In fact, intensity variation in DSOs is nothing new. What is new is
the capability to present highly compressed data files as realistic waveforms
on a raster-scan display system.
http://www.evaluationengineering.com/archive/articles/0101analog.htm
*****
Recently, new DSOs have nearly closed the last gap between digital
scopes and analog scopes. DSOs now emulate the persistence
and intensity found in analog scope displays. Indeed, these
new DSOs go further; they let you measure characteristics
such as pulse count and frequency of occurrencemeasurements you cant
make accurately with analog scopes. They also let you perform mask testing
on communications signals with the benefit of knowing what percentage of
pulses are out of tolerance.
The displays you see from the persistence in scopes with
gradient displays is different from the display persistence
you get on analog scopes and on the persistence that traditional
DSOs have had for years.
Display persistence doesnt need the accumulators
that gradient displays require.
Agilent
With standard persistence, the lit pixels decay
over time [Agilent]:
Color-grade persistence displays every written pixel until the scopes accumulator clears [Agilent]:
Scopes with gradient displays use
color or intensity to
highlight activity between the maximum and minimum amplitudes in
a column. The scope counts the number of occurrences of each ADC value
in each column. A scope might have 8 or 16 possible intensities or colors.
Each indicates a range of the number of times that the ADCs counts occurthe
number of times a pixel is hit.
Figure shows the extreme cases and an intermediate case.
Assume you can capture a square wave
with perfectly flat levels that have no noise or overshoot. If the scope
takes 500 samples for one column between the signals edges, then the scopes
ADC will produce the same count for every sample (Fig. a). The scope
will display all 500 points on the same pixel using the brightest possible
intensity (shown as darkest in the figure).
In the other extreme, assume that the scope takes 200
samples to capture the signals rising edge
(Fig. b). Also assume that the rising edge results in ADC counts
that increase by 1 with each succeeding sample. After compression, 200
of the 500 columns in a display get just one pixel hit. These 200 pixels
will light, but at the lowest possible intensity.
Color-gradient or intensity-gradient displays compress
data while preserving some of a waveforms characteristics
Now look at Figure c. This time, assume the signal
has ringing in the middle of its rise. Numerous
ADC counts will occur multiple times. Those pixels will appear brighter
than those that occur once but will be dimmer than if one pixel were hit
for each of the 500 samples as in Figure a.
In effect, a scope produces a histogram for each
column, then represents that histogram with color or intensity
(depending upon its capabilities; some scopes offer both options).
Most often, engineers use intensity because that more
closely represents the display of an analog scope.
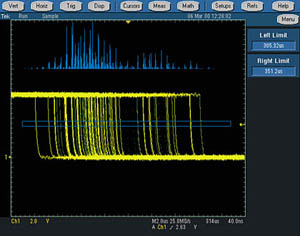
Scopes that have the accumulators can also perform measurements
on the accumulator data. For example, the falling edge of the waveform
in Figure below has a considerable amount of jitter. The colors surrounding
the brightest color (orange) indicate that the jitter has some distribution.
The histogram of the jitter, shown below the waveform, gives you a better
idea of the jitters distribution.
Scopes use the information in accumulators for color-grade
persistence (top trace) and for calculating histograms (bottom trace).
[Catenary Scientific]
http://www.tmworld.com/articles/2000/02_DSO.htm
~~~~~
Gould
TruTrace operates on 'frames'
of data which are similar to the frames required for the maximum/minimum
and '1-in-N' [simple decimation] methods of data
compression. See figure below.
The concept of a data frame arises from the conflict between limited display resolution (typically 640 horizontal locations in a VGA system of which only 500 are used) and the need to acquire large amounts of data in order to describe adequately the detailed nature of complex waveforms.
The key to TruTrace is the development of a 'data density histogram'. This consists of 254 bins, 254 being the maximum number of displayable values in the 8-bit acquisition system. Each bin is filled with the number of times that a particular vertical value occurs within the entire dot-joined data frame (assuming that all the data points within the frame have been interconnected in a simple 'join-the-dots' style). See figure below.
Each data frame is processed producing a histogram determining the display
intensity.
This histogram is then drawn along the Y-axis instead
of the more usual X-axis, so that the end result represents the relative
intensity of all the dot-joined data within the given frame -- were it
to be displayed on a high-resolution screen without compression. The more
often the waveform segment represented by the data within the given frame
crosses through a particular vertical value, the brighter it would appear
if displayed on an analog oscilloscope.
From this histogram, it is then possible to develop a
series of brightness ranges, each of which comprises a range of
contiguous bin values. For example, bin values between 0 and 10 might correspond
to brightness level 1, from 11 to 30 to level 2, etc. The vertically drawn
histogram then corresponds directly to a single vertical line comprising
many segments of different brightness.
To display a complete overview of the entire acquisition
memory contents, each data frame is considered in turn, resulting in a
display comprising 500 adjacent vertical lines, each with several quantized
brightness segments. Every data point within each data frame contributes
to the final displayed image. The overall display has the appearance
and feel of an analog oscilloscope display.
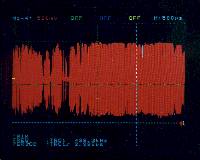
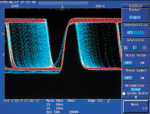
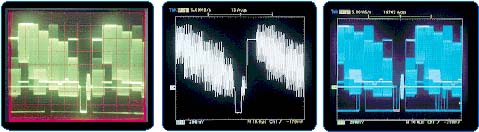
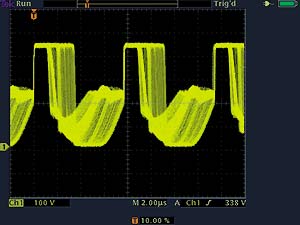
This screen shows how a conventional DSO displays a modulated signal.
This is how TruTrace displays that same signal.
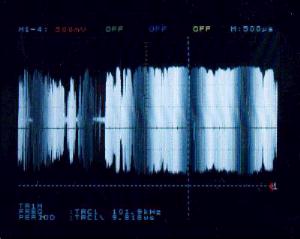
With TruTrace, seeing really is believing!
http://www.gouldis.com/trutrace.html
~~~~~
Yokogawa
All-points display & high
screen update rate. Even when capturing a waveform using long
memory, there is a big difference in how much information you can obtain
by looking at the
screen depending on the method used to display
that data.
When displaying only the representative maximum and mimum values occurring
at some particular interval, its extremely difficult to pick out abnormal
phenomena in the resultant waveform.
As shown in the figure below, the DL1740/20 displays all of
the
waveform data.
Because all of the data is displayed on the screen, you'll never overlook any abnormal phenomena.
Even with all-points display of a high volume of data acquired into
the long memory, with the DSE (Data Stream Engine) we were able to achieve
rapid data processing so the screen is quickly updated.
~~~~~
LeCroy
Analog persistence provides 16 levels
of brightness or colors to differentiate the probability of occurrence
of various waveform events. The frequency information is obtained
by using a histogram of display pixel activity. Each time
a point is written to the display it increments a histogram cell.
The cells are also subject to aging like the decay of an analog CRT phosphor.
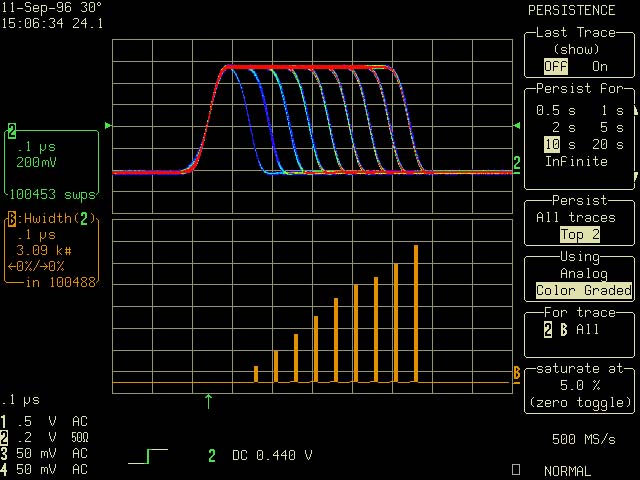
After the accumulation and aging process, the resulting
histogram, shown in Figure, is mapped to the output display. The histogram
can have up to 65, 535 counts. To use this resolution on the CRT
display, a user-adjustable saturation control sets the upper end
of the display intensity and distributes the 16 levels of intensity or
colors over the remaining range as shown in Figure B. This operation
is similar to using the intensity control on an analog scope to maximize
the displays intensity range.
Analog persistence display of a signal with elements having a variable frequency of occurrence
Color-graded persistence display of the same waveform with accompanying histogram of pulse width showing the number of pulses with each width
Metastable states induced at an asynchronous interface. Color graded persistence reveals signal distribution trends
Analog persistence allows engineers, used to viewing analog displays,
to obtain the advantages of a digital scope while retaining
the familiar feel and information content of an analog display.
Tools for data communications analysis:
http://www.lecroy.com/tm/Library/labs/LAB306a/default.asp
http://www.lecroy.com/tm/library/applications/Digital/default.asp
http://www.lecroy.com/tm/library/Videos/
~~~~~
Tektronix
Digital Phosphor Oscilloscope (DPO) takes
fast waveform captures and overlays them in a dynamic three-dimensional
database
in real time. Up to 100 million points per second are acquired and displayed
by the Tektronix DPO with DPX technology, providing an abundance of data.
Thats 1000 times faster than a typical DSO. Your signal is accurately
represented and protected from aliasing.
Intensity grading, in grayscale or color (DPX Only), provides frequency-of-occurrence information about the signal providing the visual insight and accurate data you need for qualitative and quantitative analysis.
The DPO rasterizes the digitized waveform data into a dynamic three dimensional database, called the Digital Phosphor, where chemical phosphorescence is emulated by controlling the rate of decay of the overlaid rasterized waveforms. Periodically, a snapshot of the Digital Phosphor's contents is pipelined directly to the display system. This integration of the acquisition and display systems avoids the data processing bottleneck inherent in the DSO architecture. The DPO's microprocessor works in parallel with its integrated acquisition and display system for automatic measurements, waveform math, and instrument control.
The result:
You see the signal, with great accuracy.
You store the signal, with three dimensions of information.
You can analyze the three dimensions of signal information, qualitatively and quantitatively.
DPO's provides the highest level of DPO performance by incorporating the DPX Waveform Imaging Processor into the DPO architecture.
This proprietary ASIC provides the fastest DPO glitch capture with a waveform capture rate up to 200,000 per second. Its 21 bit deep Digital Phosphor and high memory compression delivers superior display resolution and intensity grading including color. The DPX also provides access to its Digital Phosphor for analysis of the three-dimensional data, both in the DPO and on a PC. An un-triggered XY and XYZ display mode with full bandwidth make the DPO with DPX technology the perfect tool for leading edge electronic designs.
Note: DSOs (Digital Storage Oscilloscopes) process captured waveforms serially. The speed of the DSO microprocessor is a bottleneck in this process; it limits the waveform capture rate.
As a result, DSOs miss infrequent events and lack real-time response to signal changes. DSO persistence modes, which attempt to show frequency of occurrence information, take normally acquired data and post-process it to create a display that relies on a static waveform. Therefore, DSOs cant display dynamic complex signals accurately.
ART
DSO
DPO
DPX technology coupled with histogram analysis provides rapid insight into timing and amplitude distributions
DPO technology shows modulation effects on a power supply control loop
Digital scopes emulate the persistence of analog scopes, letting you distinguish a carrier from its modulation
http://www.tek.com/Measurement/scopes/dpo/flashyesno.html
http://www.tek.com/Measurement/App_Notes/Technical_Briefs/55-13757/eng/
http://www.tek.com/Measurement/cgi-bin/framed.pl?Document=http://www.tek.com/Measurement/Products/backgrounders/dpo/eng/&FrameSet=mbd
Note:
Tektronix - Scopes'r'Us as someone once said
- has developed DPO from existing InstaVu 2-dim acquisition technique
~~~~~
Fluke
CombiScopes are digital
storage
oscilloscopes (DSOs) with an analog mode built-in.
Why?
Because many users cannot rely only on the capabilities of a pure DSO.
Furthermore, some signals do not take kindly to being digitized. Examples
include simple AM signals, complex data streams and video signals.
If you do not see what you expect, or do not trust what you see, just
touch the button to switch operating mode.
DSO's have their advantages, but nothing beats an analog scope's ability
to display complex waveforms. You get faster updates and infinite
display resolution, both critical when analyzing complex or modulated
signals. With an analog scope there is no aliasing.
If you doubt the digitized signal in the DSO mode, a simple touch of
a button gives you the confidence of a second opinion, in the analog mode.
http://www.fluke.com/products/home.asp?SID=11&AGID=4&PID=1982